.png)
Constructing SOC Automation System for Malware Detection
Hey there reader!
I’ll be explaining and creating a walkthrough on how a Security Operations Center (SOC) team within an organization might create a system to generate alerts for cyber security teams and help respond to such cybersecurity threats. This walkthrough I performed will utilize various tools and platforms that will help simulate how a SOC automation system might perform within an organization.
Before we dive in on setting up the automation system, let’s remind ourselves of a keyword that will help set context on what we are trying to attempt. This keyword is SOAR which is an important term that helps describe the process of streamlining security operations smoothly and automatically. Let me parse down the acronyms for you!
S - Securtity
Security encompasses the foundational components that protect an organization's data, systems, and networks from cyber threats. It is a multifaceted approach that includes various layers and tools designed to detect, prevent, and respond to security incidents.
+
O - Security Orchestration
This component involves connecting and coordinating various security tools and systems. It’s considered the bridge that allows a variety of security solutions to connect with one another such as intrusion detection systems (IDS), security information and event management (SIEM) systems, and endpoint detection and response (EDR) tools. All these tools are just like how a symphonic band is arranged! Some well-known security tools you might’ve heard like Wazuh, Shuffle, TheHive, or VirusTotal can complement each other to help create an effective infrastructure to help communicate and collaborate effectively regarding security-related matters throughout an organization. I’ll also be using these tools to help create our automatic system during our walkthrough!
+
A - Automation
While having a setup of security tools is crucial, efficiently transferring processes and information between these tools—like data, logs, alerts, and notifications—requires more than manual oversight. Imagine needing to manage thousands of logs and create personalized alerts for hundreds of employees based on their roles—it'd be overwhelming and inefficient to rely solely on human resources for these impending doom of a task.
Fortunately, modern security tools come with built-in configurations that seamlessly connect and collaborate across different platforms. These configurations handle custom actions, trigger workflows, and manage the flow of information both inbound and outbound from a tool or system.
Essentially, these tools act as capable orchestrators or have their very own symphonic conductor themselves, efficiently managing a wide array of tasks with continuous speed and precision throughout a cybersecurity system.
Having automation leads to supporting and performing repetitive tasks that would typically require manual intervention. This includes tasks such as data collection, alert triage, threat intelligence gathering, and even some aspects of incident response. Automation also helps reduce the workload on security analysts, allowing them to focus on more complex and high-priority tasks.
+
R - Response
This refers to how a security team or its automated system reacts to a detected security incident or threat. This starts off with continuous monitoring by an automated system, which promptly detects and triggers alerts upon identifying potential threats or anomalies. We then either have the system or a security team member(s) themselves rank the alerts based on their severity and impact, ensuring that critical issues are addressed with utmost urgency. It then leads to an alert’s corresponding response which can execute such response activities like containing threats, applying remediation measures, and notifying relevant stakeholders and team members. This can be comparable to a well-rehearsed symphonic band whose musicians properly react to a music note! Automation has also promoted the response component through effective incident handling, reducing response times and minimizing potential damages. With the integrated support of automation it helps better comprehend risks and make more strategic and educated judgments about how to respond. The response after every post-incident case is also integral since it constantly improves vulnerabilities within a method, structure, or an automated response system, thus fortifying an organization’s overall cybersecurity defenses.
_______________________________________________________________________
And that’s what SOAR is!!!
Let’s begin the walkthrough on setting up the Automation system!
The 1st step in creating a lab automated system is to first think about the goal and the topology, the physical and logical structure of a network. Our goal for a SOC automation system is to help create a system to generate alerts for cyber security teams and help respond to such cybersecurity threats. Once a goal is set, we need to create the diagram or topology of the system, like this:
This lab diagram is a visual representation of the data flow that is numbered to keep track of how it flows and required components for building a comprehensive Wazuh instance with SOAR integration, thanks to Shuffle, and case management using The Hive.
Now, what are Wazuh, Shuffle, and The Hive? Wazuh is a security platform that helps protect computer systems from threats by monitoring their activity and alerting users to suspicious behavior. It essentially acts like a digital guard dog for your devices. Shuffle is an open-source SOAR platform that helps organize security events which allows for the collection, enhancement, automation, and response to security incidents with minimal human involvement. Finally, The Hive is a collaborative incident response platform that helps teams manage and resolve cybersecurity threats effectively, acting like a virtual war room for experts to coordinate their efforts.
After completing the diagram, I focused on installing the necessary applications and virtual machines to make our SOC functional. I deployed a virtual machine with a Windows operating system by downloading a Windows 10 .iso file and deploying it on the downloaded Oracle VM Virtualbox - Windows 11 works fine as well as other VMs like “VMWare”. I also installed Sysmon for monitoring incidents with a configuration file from a github user named “olafhartong”, who is well-known for his Sysmon configuration modules since it has extensive coverage over potential malicious activities and is regularly optimized by the create or the github community themselves. I also want to note that there are other types of Sysmon configs on the internet or you are able to develop one yourself to utilize.
To download Sysmon, one could easily search it up and download it from the microsoft website. You are given 2 options to either download it for WindowsOS/SierraOS, or the Linux version. In this walkthrough I will be downloading for the WindowsOS, which is represented in this picture:
Once downloaded, you will also head to github to download the config file from Olaf, which is the file’s sole purpose is to defend against MITRE ATT&CK’s database of known adversarial tactics and techniques:
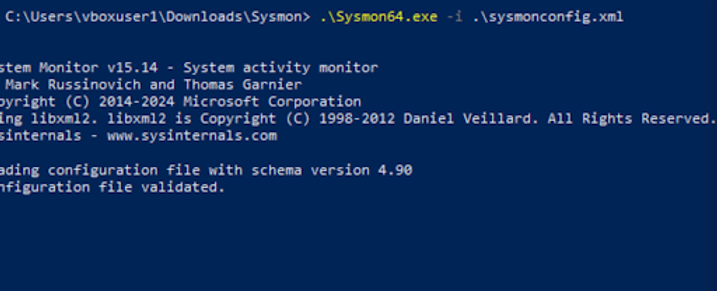
Once downloaded, I ran the PowerShell application and execute the download of Sysmon within its folder and run “.\Sysmon64.exe -i .\sysmonconfig.xml”, the sysmonconfig.xml is the file I name for the Olaf configuration. You will see the powershell window installing Sysmon with the configuration file and end with, “Sysmon64 started.” To confirm that you’ve downloaded Sysmon, you can check either with services or events viewer to see if Sysmon is configured.
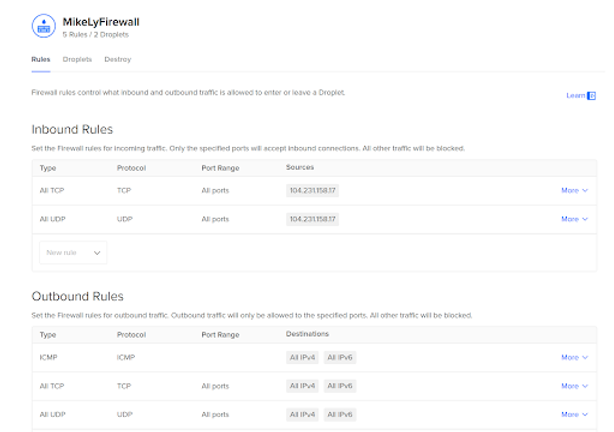
The next step is to create VMs to host Wazuh and The Hive which I’d utilized a cloud VM platform called DigitalOcean. The VMs in DigitalOcean are known as droplets. When configuring the VMs, I utilized the Ubantu OS to host the VMs on, and made sure to check for the default configurations to make sure it doesn't allow any public connections, and create/edit the firewall to only communicate with one’s ip address. Here are the recommended configurations I recommend for both Wazuh and “The Hive”:
Wazuh and “The Hive” Specifications:
OS: Ubuntu
Version: 22.04 or Whatever is listed as the most up-to-date
Plan and Specs: Select the "Basic" plan. Under "CPU Options", choose Premium Intel with NVMe SSD. Ensure your droplet has at least 8GB of RAM and 50 GB of hard drive space. This configuration is typically priced at $48/mo.
Once my VMs were created, I used SSH (secure shell) access the Wazuh server. The default username is `root`, and the password is the one you set during the droplet setup.
After SSHing I ran “apt-get update && apt-get upgrade -y” in the command line to update installed packages of the VM. Once doing so, you will be introduced to selection prompts in which the highlighted will be the selection:
After selection, you will have a command line interface (CLI) shown which you can initiate the Wazuh installation by running these commands:
-
curl -sO https://packages.wazuh.com/4.7/wazuh-install.sh && sudo bash ./wazuh-install.sh -a
-
sudo tar -xvf wazuh-install-files.tar
Note: You will be provided an account username and password within the CLI at the end of your installation. Take note of the credentials to access your Wazuh dashboard.
Once completed, go ahead and direct yourself to a new tab and add this into the address bar: https://<your_server_ip> and then login with the obtained credentials gained after the installation:
You then will be greeted to the Wazuh dashboard which means you have successfully accessed and created your Wazuh server. The Wazuh dashboard can now be utilized!:
For installing the Hive, we must implement the necessary components to ensure it’s successful which are: Cassandra, Elasticsearch, Java, and The Hive itself.
Once my VMs were created, I used SSH (secure shell) access the Wazuh server. The default username is `root`, and the password is the one you set during the droplet setup.
After SSHing I ran “apt-get update && apt-get upgrade -y” in the command line to update installed packages of the VM. Once doing so, you will be introduced to selection prompts in which the highlighted will be the selection:
Installing Prerequisites
Installing Java:
Before installing Java, you need to install several packages by running these commands:
apt install wget gnupg apt-transport-https git ca-certificates ca-certificates-java curl software-properties-common python3-pip lsb-release
You then encounter a selection prompt and select cron.service:
Troubleshoot notes- If the "wget" command doesn't work for Java, it could be due to an incorrect or outdated URL, or because wget hasn't been installed. Try the following commands for a quick fix:
-
sudo apt install wget
-
sudo apt update
Once on this main CLI screen:
Run the following commands to completely install Java:
-
wget -qO- https://apt.corretto.aws/corretto.key | sudo gpg --dearmor -o /usr/share/keyrings/corretto.gpg
-
echo "deb [signed-by=/usr/share/keyrings/corretto.gpg] https://apt.corretto.aws stable main" | sudo tee -a /etc/apt/sources.list.d/corretto.sources.list
-
sudo apt update
-
sudo apt install java-common java-11-amazon-corretto-jdk
-
echo JAVA_HOME="/usr/lib/jvm/java-11-amazon-corretto" | sudo tee -a /etc/environment
-
export JAVA_HOME="/usr/lib/jvm/java-11-amazon-corretto"
Installing Casandra:
Before installing Cassandra , you need to install several packages by running these commands:
-
wget -qO - https://downloads.apache.org/cassandra/KEYS | sudo gpg --dearmor -o /usr/share/keyrings/cassandra-archive.gpg
-
echo "deb [signed-by=/usr/share/keyrings/cassandra-archive.gpg] https://debian.cassandra.apache.org 40x main" | sudo tee -a /etc/apt/sources.list.d/cassandra.sources.list
Run the following commands to completely install Cassandra:
-
wget -qO - https://artifacts.elastic.co/GPG-KEY-elasticsearch | sudo gpg --dearmor -o /usr/share/keyrings/elasticsearch-keyring.gpg
-
sudo apt-get install apt-transport-https
-
echo "deb [signed-by=/usr/share/keyrings/elasticsearch-keyring.gpg] https://artifacts.elastic.co/packages/7.x/apt stable main"
Installing The hive:
Run the following commands to completely install The Hive
-
wget -O- https://archives.strangebee.com/keys/strangebee.gpg | sudo gpg --dearmor -o /usr/share/keyrings/strangebee-archive-keyring.gpg
-
echo 'deb [signed-by=/usr/share/keyrings/strangebee-archive-keyring.gpg] https://deb.strangebee.com thehive-5.2 main' | sudo tee -a /etc/apt/sources.list.d/strangebee.list
After completely installing the necessary components, The Hive is now accessible on port 9000. The default credentials are "admin@thehive.local" with the password "secret"
Congratulations, you have now successfully installed The Hive!
Initial Configuration of The Hive
After installing The Hive and its components such as Cassandra and Elasticsearch, the first step is to configure these components effectively. Then I configured The Hive by modifying the necessary files to link it to the IP address of the VM hosting The Hive. This included updating the listen_address, rpc_address, seed provider, cluster name, network host, HTTP port, and other settings.
Configuring Cassandra
Cassandra acts as the database for The Hive. You need to adjust its configuration files for proper communication and functionality.
-
Open the Configuration File: Use the command nano “/etc/cassandra/cassandra.yaml” to edit the file. (Note: The path may vary based on your installation.)
-
Cluster Name: The default “cluster_name” might be set to "Test Cluster." Change this to something relevant to your setup.
Addresses Configuration:
Set listen_address to the server's IP where Cassandra is running. Also, Set rpc_address to allow connections.
Seed Provider:
In the seed_provider section, replace the local host IP in the "seeds:" section with your Hive's public IP address.
Save and Exit:
Finally press Ctrl + X to exit, Y to save, then press Enter.
Restart Cassandra:
Stop the service: systemctl stop cassandra.service
Remove old files: rm -rf /var/lib/cassandra/*
Start the service: systemctl start cassandra.service
Check the status: systemctl status cassandra.service
Configuring Elasticsearch
Elasticsearch is used to manage data indices and query large amounts of data.
Open the Configuration File: Use the command nano /etc/elasticsearch/elasticsearch.yml to edit the file.
Cluster Name: Change cluster_name from "my-application" to "thehive."
Node Name: Uncomment and set node.name to "node-1."
Paths: Use the default paths.
Network Settings:
Uncomment and set network.host to The Hive's public IPv4.
Uncomment http.port and keep it as default (9200).
Discovery Seed:
Uncomment cluster.initial_master_nodes and delete "node-2" if there is no second node.
Start and Enable Elasticsearch:
Start the service: systemctl start elasticsearch
Enable Elasticsearch: systemctl enable elasticsearch
Check the status: systemctl status elasticsearch.service (Press "q" to exit)
Check Cassandra Service: Ensure Cassandra is still running: systemctl status cassandra.service
Configuring The Hive
Set Permissions: Give The Hive user and group access to the file path.
Check current permissions: ls -la /opt/thp
Change ownership: chown -R thehive:thehive /opt/thp
Verify permissions: ls -la /opt/thp
Edit The Hive's Configuration File:
Open the file: nano /etc/thehive/application.conf
Update the IP address in the hostname section to your Hive server's public IP address.
Set cluster-name to match the one used for Cassandra (e.g., "Test Cluster").
Replace localhost with your Hive server's IP address in application.baseURL.
Save and Exit:
Press Ctrl + X to exit, Y to save, then press Enter.
Startup The Hive:
Start and enable The Hive: systemctl startup thehive and systemctl enable thehive
Check the status: systemctl status thehive (Note: You may need to run sudo apt update for the commands to work)
Access The Hive Dashboard:
In your web browser, go to http://thehiveserverIPaddress:9000
Log in with the default credentials:
Username: admin@thehive.local
Password: secret
Configuring Wazuh
With The Hive configured, proceed to set up the Wazuh server for collecting and analyzing security data, integrating it with The Hive for incident response.
Wazuh Server Setup
Integration with The Hive: Configure Wazuh to forward alerts and create incidents in The Hive by setting up the correct API endpoints and securing the communication between them.
Windows 10 Client Reporting:
Install the Wazuh agent on the Windows 10 client.
Configure it with the Wazuh server's address.
Ensure proper authentication for reporting to Wazuh.
Once The Hive was configured, I signed in, created user accounts, and set up a service account for Shuffle. For Wazuh, with an installed agent onto my Windows machine, I downloaded Mimikatz onto my Windows VM. Running Mimikatz generated telemetry, which was picked up by the sysmon event logs while having Wazuh detect it and sending the event to Shuffle.
I also adjusted Wazuh settings, filtered specific event IDs, set up Sysmon logs, and created alerts for Mimikatz by creating a rule.
The final step was automation where I initiated a webhook that sent telemetry from the Wazuh manager to VirusTotal using its API, which verified the file's hash reputation and included important information like the computer's name and time. An alert was generated in The Hive after setting it up.
Finally, an email would be sent to the SOC analyst with insightful information from VirusTotal, a service that analyzes files, ip addresses and domains for malware, so they could respond and mitigate the issue.
Alert email notification:
In conclusion, this project has successfully automated the identification and response to cybersecurity threats by utilizing tools such as Wazuh, Shuffle, TheHive and VirusTotal. By combining these platforms we ensure threat detection while minimizing alarms thereby strengthening our ability to address breaches and malware effectively.
Take-away:
The key takeaway from this project is the hands-on experience gained in planning, implementing and analyzing a SOAR based SOC automation system. It was a fulfilling journey that enhanced my skills and confidence in automating tasks and understanding the role of a SOC analyst. The successful creation of a SOC Automation Lab by integrating platforms like Wazuh, TheHive and Shuffle forms a foundation for initializing and configuring automated event monitoring and incident response. Some notable takeaways gained include configuring Sysmon on a Windows 10 client, deploying Wazuh for event management purposes, setting up TheHive for case handling tasks and utilizing Shuffle for streamlining workflow processes. This experience gives me insight into how to improve security operations efficiency and optimize incident response protocols. This also helps me understand how to streamline SOC workflows moving forward. Ongoing refinement of automation workflows and integration of tools along with threat intelligence sources are vital for maintaining a security stance against evolving threats. In summary, I have gained more confidence in leveraging the capabilities of platforms to help create a reliable SOC automation system to effectively identify, alert, and respond to security incidents swifty.